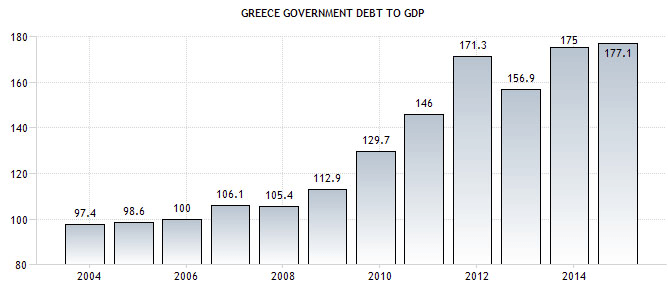
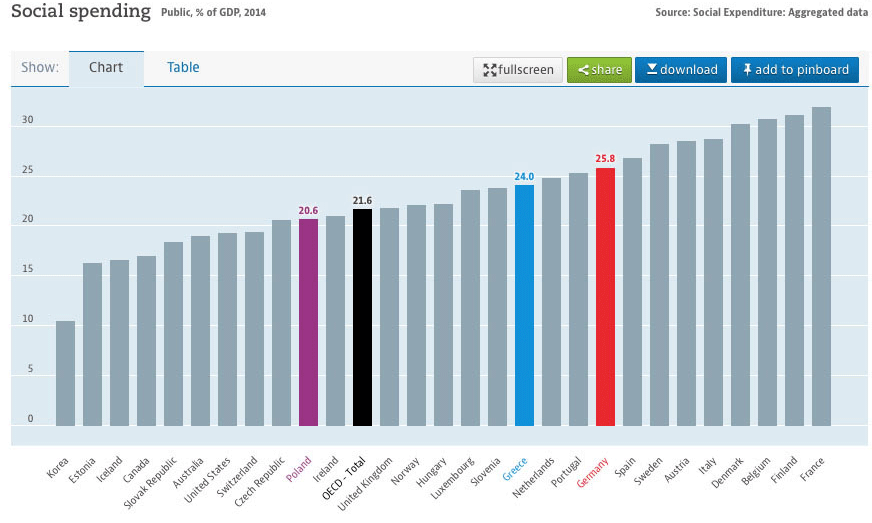
Figure 1—Greece’s Debt to GDP vs. Social Spending
Source: https://data.oecd.org/greece.htm

|
Figure 1—Greece’s Debt to GDP vs. Social Spending
|
||||
 |
 |
|||
|
Source: https://data.oecd.org/greece.htm
|
||||
| Even though the cost of servicing Greece’s debt ballooned after 2008 (left), Greece’s social spending as a per cent of GDP (right) is lower than Germany’s. | ||||
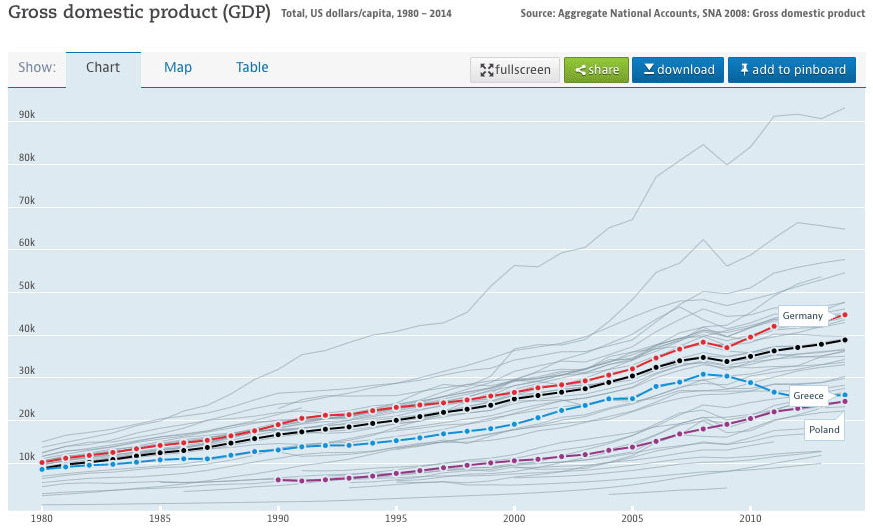
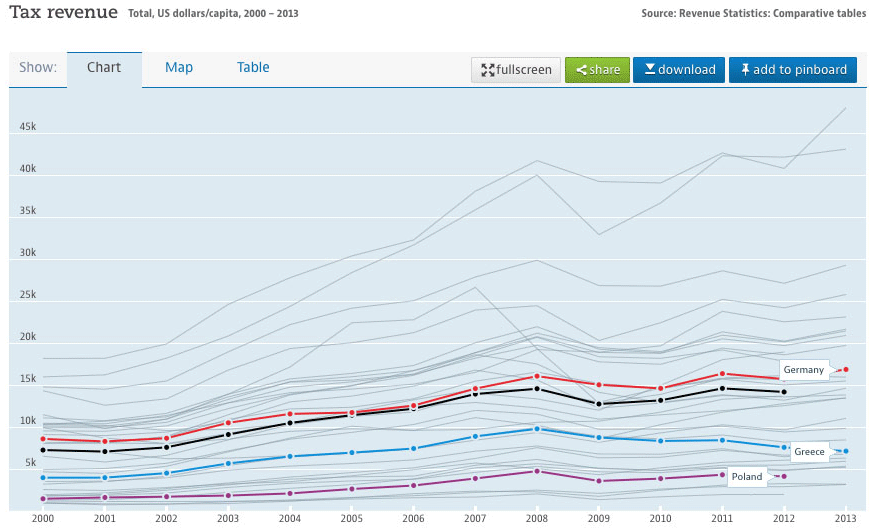
| Figure 2—2008 and Greece’s descent into insolvency | ||||
 |
 |
|||
|
|
||||
 |
 |
|||
|
|
||||
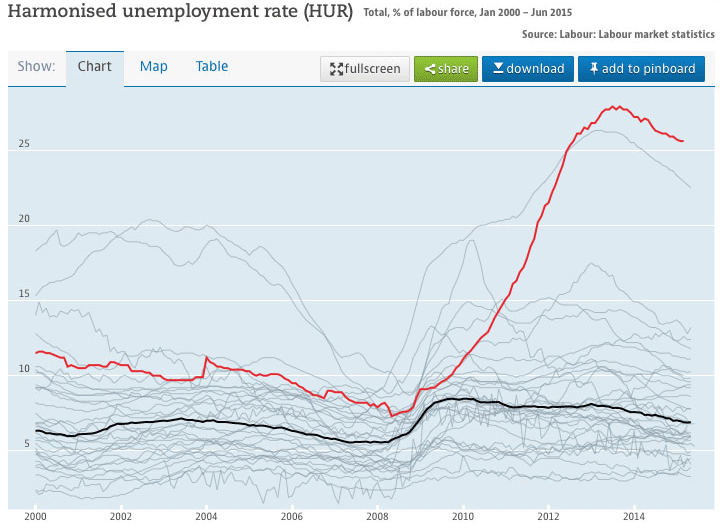
| Each of these four graphics shows that until 2008 Greece had been more or less economically stable. The GDP (UL) and tax tevenue (UR) were both rising; debt to GDP, though still unacceptably high, dipped marginally from 2007; and unemployment* had been in general decline since 2004. Only after the bankster-generated financial disaster did Greece‘s financial condition deteriorate into insolvency. The austerity measures imposed on Greece by the troika, are therefore morally and economically incompetent and must reflect malicious political motives. | ||||
| * “Harmonized unemployment rates define the unemployed as people of working age who are without work, are available for work, and have taken specific steps to find work. The uniform application of this definition results in estimates of unemployment rates that are more internationally comparable than estimates based on national definitions of unemployment. This indicator is measured in numbers of unemployed people as a percentage of the labour force and it is seasonally adjusted. The labour force is defined as the total number of unemployed people plus those in civilian employment.” (OECD) | ||||